SigMT Metronix
SigMT Metronix User Guide
Install Anaconda
I recommend installing Anaconda for using SigMT. Download Anaconda here.
Install SigMT
Option 1: Install from pip
Open Anaconda Prompt and run:
> pip install sigmt
Option 2: Install from GitHub
Open Anaconda Prompt, create a new environment, and clone the repository:
        > conda create --name sigmt
        > conda activate sigmt
        > git clone https://github.com/ajithabhks/sigmt.git
        > cd sigmt
        > pip install -e .
Update SigMT
Option 1: Update pip installation
Open Anaconda Prompt and run:
> pip install --upgrade sigmt
Option 2: Update GitHub installation
If SigMT was installed by cloning the GitHub repository, open Anaconda Prompt, activate the environment, navigate to the SigMT repository, and pull the latest changes:
      > conda activate sigmt
      > cd sigmt
      > git pull
      > pip install -e .
Opening SigMT
Open Anaconda Prompt.If Option 1 (Install from pip) is used for installation. Type:
> sigmt
Open Anaconda Prompt.
If Option 2 (Install from GitHub) is used for installation. Type:
        > conda activate sigmt
        > sigmt
SigMT Main Window
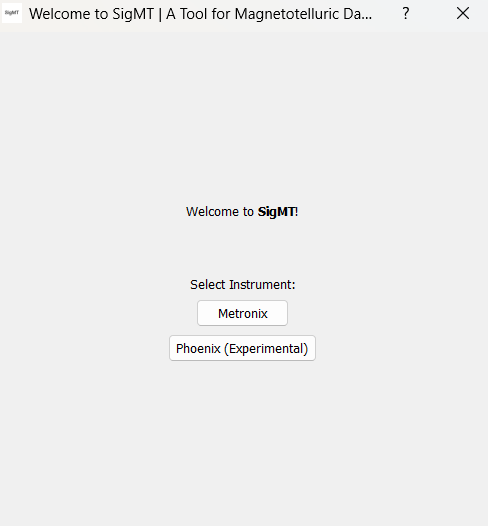
Choose Metronix from the main window.
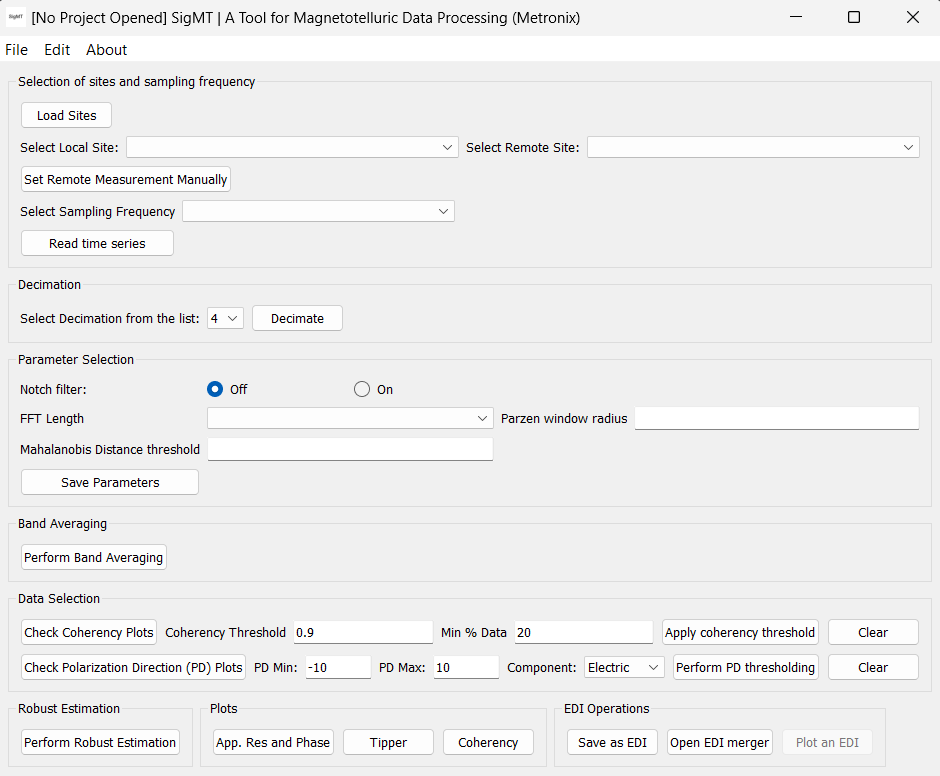
Metronix Processing Window
This is the main processing window for Metronix.
Create a Project
Click File → Create Project
Choose a folder for the project.
Then the below pop window appears.
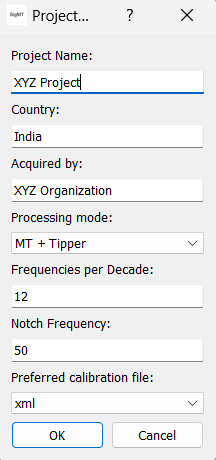 Enter your project details. There are two processing modes. 'MT + Tipper' and 'MT Only'
Provide the notch filter frequency for the study area. Default is 50 Hz.
Click 'Ok'.
Project Folder
Go to the project folder. You will see following folders.
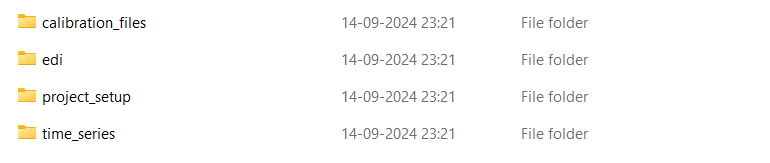 Copy your station data into the time_series folder.
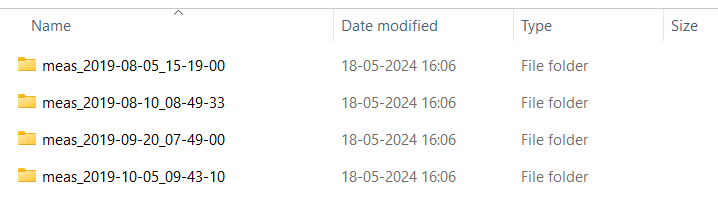
For example:
 Please make sure that the station folder contains only measurement (meas) folders.
Open a Project
File → Open a Project
If there is an already existing SigMT project, you can open it using 'Open a Project' option.
Edit Project Setup
File → Open a Project
Use Edit → Edit Project Setup to modify the project setup.
Processing Explained
- Click on 'Load Sites' to get list of sites in the 'time_series' folder.
- Choose 'Local' and/or 'Remote' station.
Choose the site and/or remote site to process.
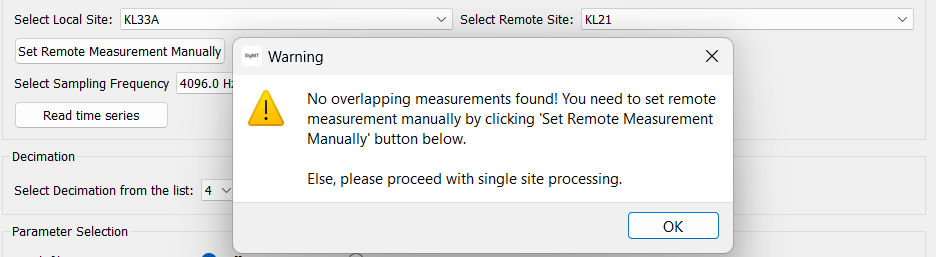
(ONLY IF) If SigMT shows a popup as below, click 'Set Remote Measurement Manually' button.
This happens if local site and remote site measurements are not simultaneously started and stopped.
If local site and remote site measurements are simultaneously started and stopped, the names of measurements will be same and program identified them autonomously.
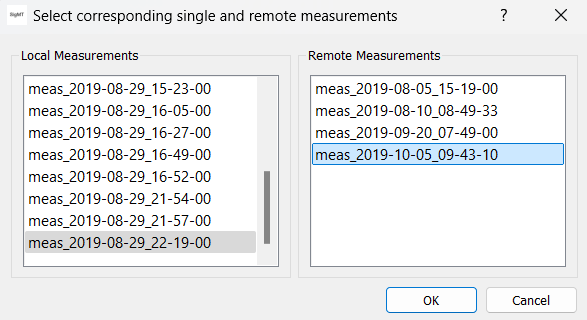
If you know the exact remote measurements, select the measurements as following and click 'OK'.
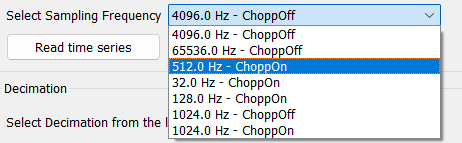
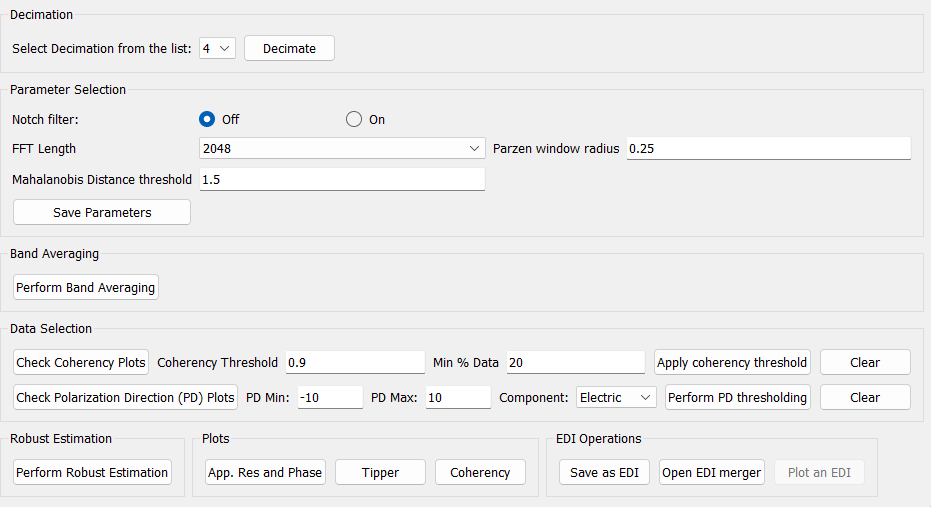
- Select Sampling Frequency from drop down.
- Click 'Read time series' button.
- If you need Decimation, select the decimation (4 or 8) and click 'Decimate'. New sampling frequency will be old/decimation_value (For eg: 512/4 = 128 Hz).
-
Choose required parameters such as 'Notch filter off or on',
'FFT Length', 'Parzen window radius', 'Mahalanobis Distance threshold'
and click 'Save Parameters'.
⚠ Parameter Selection Tips
SigMT gives you full control over these processing parameters. Use this flexibility to test different settings rather than relying on a single combination of parameters.
- FFT Length: If you are struggling to obtain sounding curve points at lower frequencies, try increasing the FFT Length.
- Parzen Window Radius: A larger Parzen window radius may produce a smoother-looking sounding curve, but excessive smoothing can introduce a downward bias in the result. Start with a smaller Parzen window radius and increase it gradually, and make sure you are not biasing the results.
- Click 'Perform Band Averaging'.
- Choose coherency threshold and 'Min % of Data' (Minimum percentage of data) if required. Min % of Data makes sure that atleast that much percentage data will be available after coherency based rejection. It helps to prevent crashing of robust regression.
- Choose polarization direction thresholding to reject data based on it. Read SigMT paper for more information. If PD min = -10 and PD max = 10, then the data between this range will be rejected.
- Click 'Perform Robust Estimation' to perform robust regression.
- You can see plots by clicking button in 'Plots section'.
Save EDI
Click on 'Save as EDI' button to save EDI files.
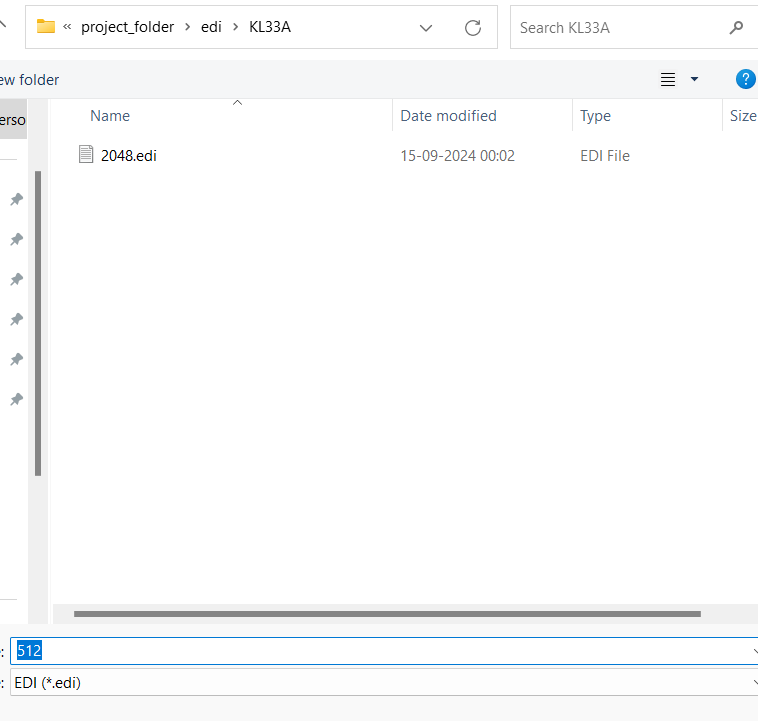
Save it in 'edi' folder in project folder or wherever you like.
Keep it a folder with site name (in below example: KL33A). In SigMT, the idea is to create
seperate EDI files for each sampling frequency.
For example: 2048 Hz, 512 Hz, etc. Then later joins it using the 'EDI Merger'.
EDI Merger
Click 'Open EDI merger' to open EDI merger.
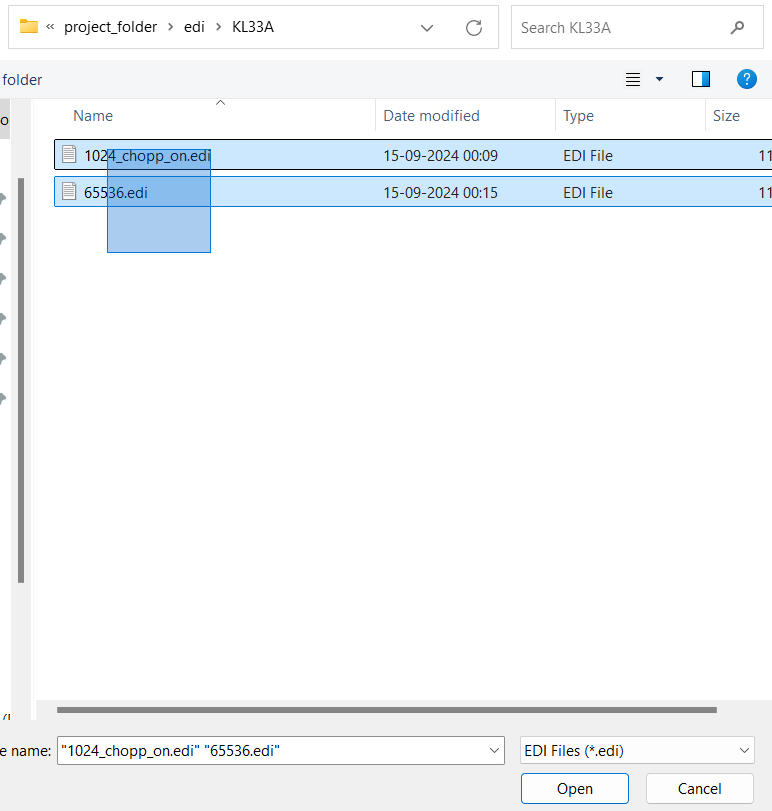
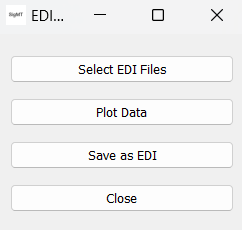 Click on 'Select EDI Files' and go to the folder where EDIs are stored.
Select the EDI files that need to be merged and click 'Open'.
Click on 'Select EDI Files' and go to the folder where EDIs are stored.
Select the EDI files that need to be merged and click 'Open'.
 Click on 'Plot Data' to manually delete bad data points and duplicate data points.
IMPORTANT: PLEASE SURE THAT THERE EXIST NO TWO DATA POINTS FOR SAME FREQUENCY
The plot will appear as below. Data points will have different colors based on the sampling frequency.
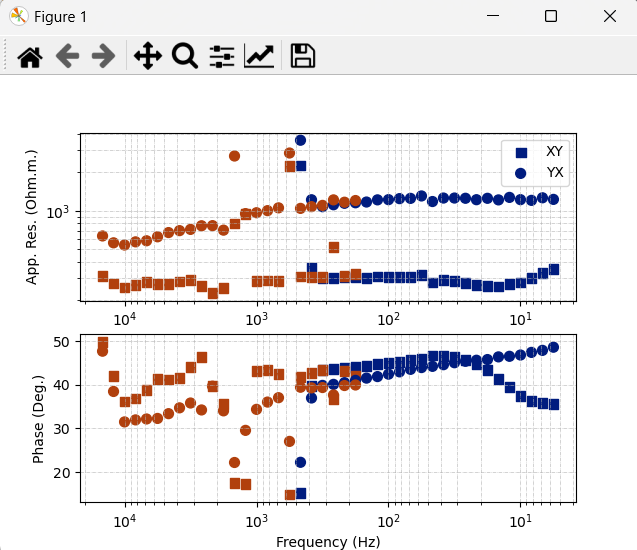 USE ONE LEFT CLICK to delete a point.
USE ONE RIGHT CLICK to undo once (only once!!).
After cleaning, it may look like:
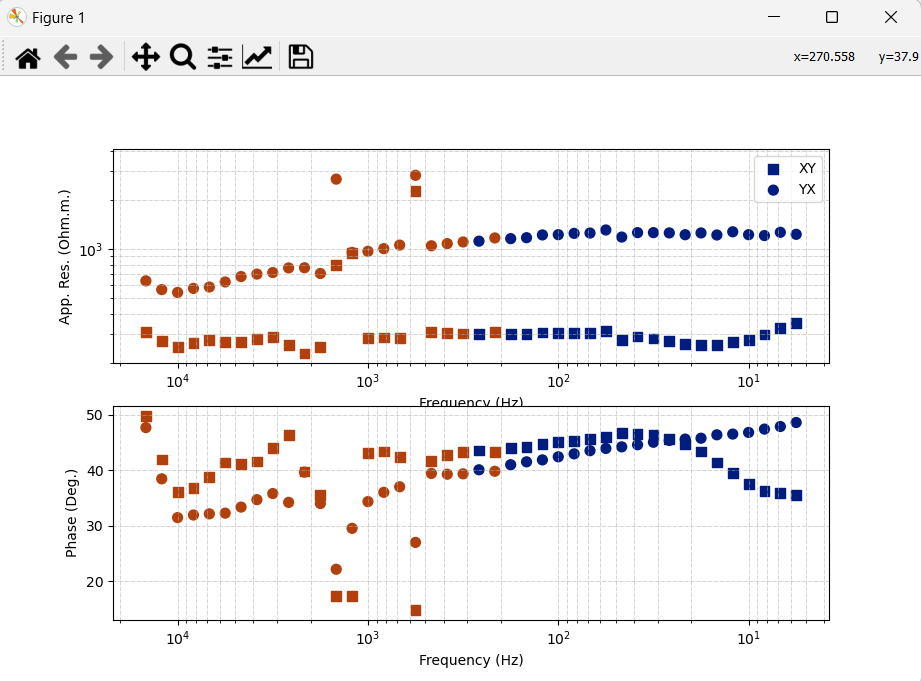 Keep the window plot open and click 'Save as EDI' to save final merged EDI'.
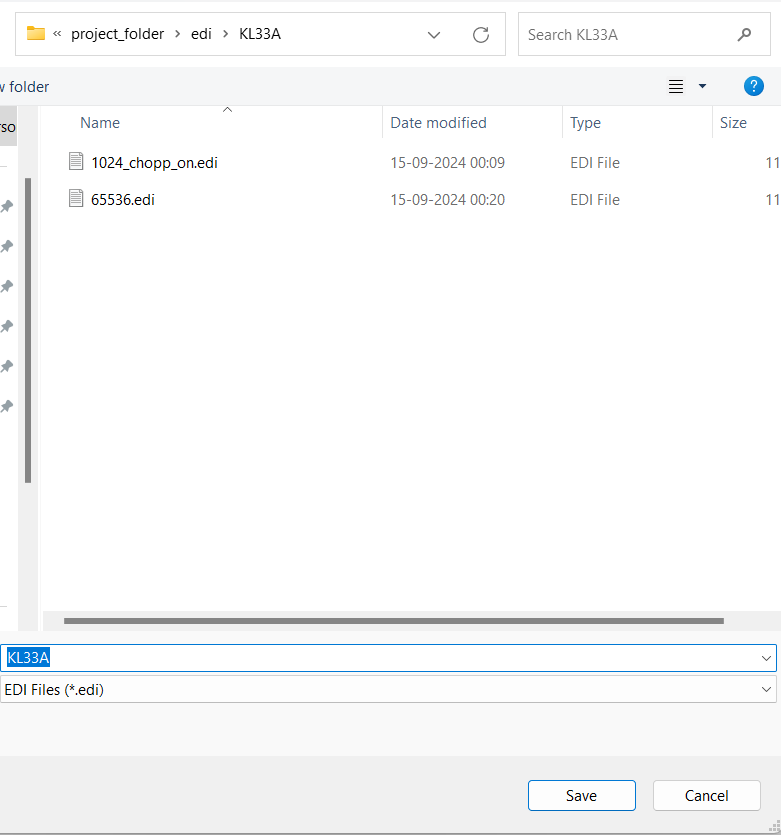 You can use site name for the final EDI.
DONE!!
You can use site name for the final EDI.
DONE!!